| |
| |
One fairly new area of mathematics has found increasing application in
social sciences and management. A brief introduction to this branch of mathematics,
called graph theory, is given in this chapter. The use of the word
graph in this chapter has no relationship to the word graph
used earlier, as in “the graph of the equation y = 2x + 5.” The alternate
definition of a graph for this chapter is given in the first section. |
|
|
|
|
|
In each of the past few presidential election years, one party or the
other has had a large number of candidates competing in the presidential
primaries held in the various states. Not all the candidates compete in
each state. For example, candidates A and B might be the only candidates
in one state primary, while another state race might see candidates A,
C, and D on the ballot.
Suppose that in one year six candidates, A, B, C, D,
E, and F, compete for the presidential nomination. Suppose also that after
a few state primaries, the situation is shown in the following table.
| Candidate |
Opponents |
| A |
B, D, and F |
| B |
A and D |
| C |
No one |
| D |
A, B, E, and F |
| E |
D |
| F |
A and D |
|
|
|
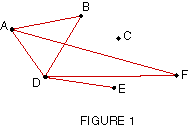
The information in this table can also be given in
a diagram, as in Figure 1, where each candidate is represented by a point,
and each line connecting a pair of points represents a primary contest
between the two candidates.
The diagram in Figure 1 is called a graph; each
of the points A, B, C, D, E, and f is a vertex, and the lines AB,
AD, BD, and so on, are called edges. While the edges in Figure
1 are straight lines, this is not at all necessary by definition. (Notice
that the point where DB and AF cross is not a vertex.)
|
| GRAPH |
A graph is made up of a finite umber of vertices
A, B, C, . . ., N, together with a finite number of edges AB, AC,
BC, . . ., each joining a pair of vertices.
|
|
As shown in Figure 1, no all vertices must have edges;
there are no edges ending at vertex C, for example.
In our example of the presidential candidates, it is
certainly possible that candidates A and B might run against each other
in more than one state primary, so that more than one edge could connect
A and B.
|
|
|
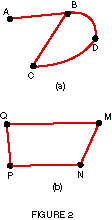
EXAMPLE 1
Identify all vertices and edges in Figure 2.
- The graph shown in Figure 2(a) has four vertices, A, B, C, and D,
with edges AB, BC, CD, and DB.
- The four vertices in Figure 2(b) are M, N, P, Q; the edges are MQ,
QP, PN, and NM.
|
|
|
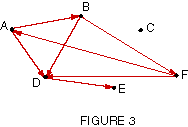
It could be very useful to modify the graph of Figure
1 so that the winner of each election were indicated. Suppose that
| A |
defeated B and D, but lost to F; |
| B |
defeated D and F, but lost to A; |
| C |
did not run; |
| D |
defeated E, but lost to A, B and F; |
| E |
lost to D; |
| F |
defeated A and D, but lost to B; |
This information can be added to Figure 1 by making
each edge into a directed edge, an edge with an arrowhead. The
arrowhead points to the loser of each election. Figure 3 shows the modified
graph.
The graph in Figure 3, with directed edges, is a directed
graph, or digraph.
|
| DIGRAPH |
A directed graph or digraph, is made
up of a finite number of vertices, A, B, C, . . ., N, together with a finite
number of directed edges, AB, AC, BC, . . ., each joining a pair of vertices.
|
| |
In a graph, the edge AB is the same as the edge BA.
In a digraph, however, the order AB is used to show that the arrowhead points
from A to B, so that AB is not the same as BA.
|
|
|
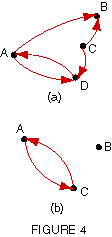
EXAMPLE 2
Identify all vertices and edges in each digraph in Figure 4.
- The vertices Figure 4(a) are, A, B, C, and D. The directed edges are
AD, DA, AB, CB, and CD.
- The digraph in Figure 4(b) has vertices A, B, and C, with directed
edges AC and CA.
|
| |
Matrix Representation of Digraphs
Recall the relationship between transition matrices and transition diagrams
in Chapter 8. As shown here, a matrix is a very useful way to represent
the information in a graph or digraph. After a matrix is obtained from a
digraph, the results of Chapter 2 can be used to obtain further information.
A square matrix is obtained from a digraph by placing in row A and column
B the number of directed edges from A to B. By definition of a digraph,
there can only be 0 entries in the row 1 column 1 position, the row 2 column
2 position, and so on.
|
|
EXAMPLE 3
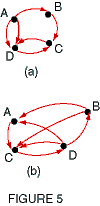
Write a matrix corresponding to each digraph in Figure 5.
- In Figure 5(a), there are two directed edges from A to C, so the number
2 is placed in row 1, column 3. Place 1 in row 1, column 2, because
of the one directed edge from A to B; put 0 in row 2, column 1. Complete
the matrix as follows.
|
A |
B |
C |
D |
| A |
 |
| B |
| C |
| D |
- The matrix for the digraph in Figure 5(b) is as follows.
|
A |
B |
C |
D |
| A |
 |
| B |
| C |
| D |
|
| |
Note that the matrix in Example 3(b) contains only
0 and 1 as entries. Such a matrix is called an adjacency matrix.
|
Exercises
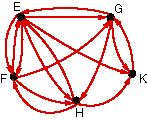
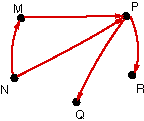
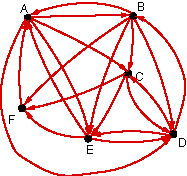
In exercises 1-12, write a matrix for each digraph.
Identify any adjacency matrices
| 1. |
 |
2. |
 |
3. |
 |
| 4. |
 |
5. |
 |
6. |
 |
| 7. |
 |
8. |
 |
9. |
 |
| 10. |
 |
11. |
 |
12. |
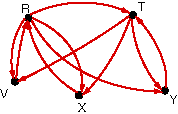 |
Sketch a digraph for each of the following matrices.
| 13. |
 |
14. |
 |
15. |
 |
16. |
 |
17. |
 |
| 18. |
 |
19. |
 |
20. |
 |
21. |
 |
22. |
 |
|
| |
Applications
SOCIAL SCIENCES
Draw a digraph and write a matrix for each of the following situations.
|
| Interpersonal Relationships |
| 23. |
Among the four people Al, Bill, Cynthia, and Donna, Al can't stand
Bill or Cynthia, but likes Dona; Bill can't stand Al, but likes the
other two; Cynthia doesn't like Bill or Donna, but likes Al, and Donna
doesn't like anyone. No one dislikes himself or herself. |
|
| Election Results |
| 24. |
In a series of elections, A defeated B and C but lost to D, B defeated
D but lost to A and C, C defeated D and B but lost to A, and D defeated
A but lost to B and C. |
|
|
| |


